


Animated Data Presentation with Dynamic Charts and Graphs
By Stockpot49Attributes
- Length
- 0:07
- Resolution
- 3840 x 2160
- File Size
- 1.04 MB
- Frame Rate
- 29.97 fps
- Alpha Channel
- No
- Looped
- No
- Video Encoding
- H.264
- Orientation
- Horizontal
- Commercial License
- Further Information
Description
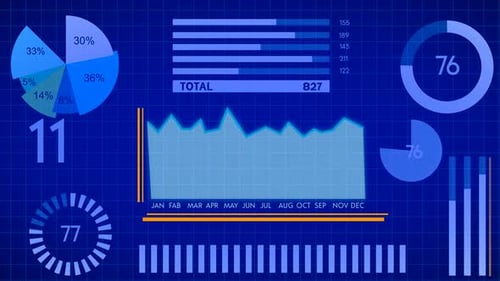
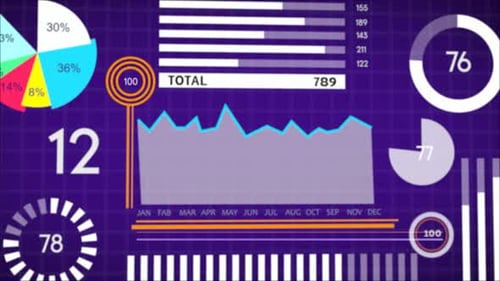
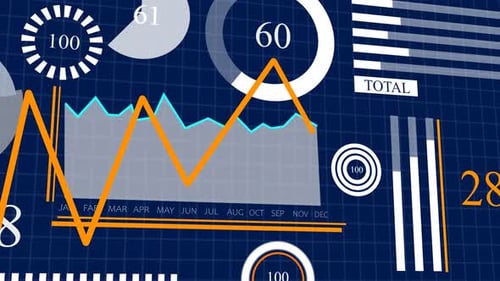
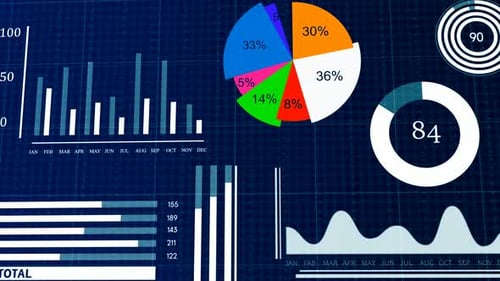
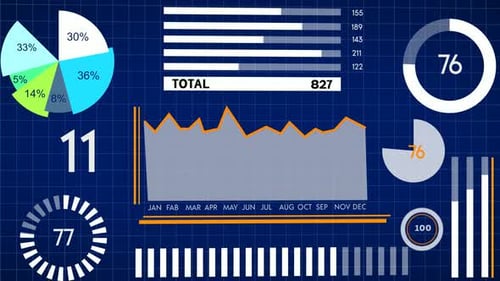
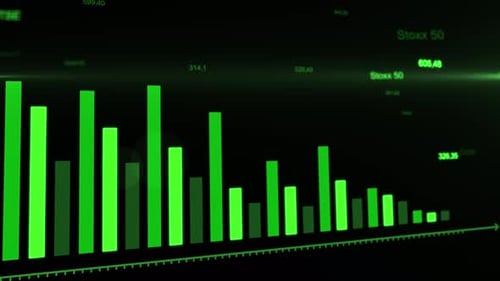
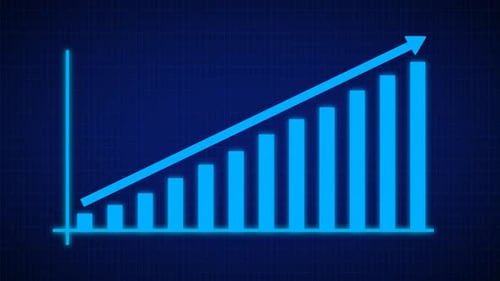
This animated infographic features a dynamic display of various data visualizations against a black grid background. Bar charts grow, representing monthly data, while a line graph illustrates trends over time. A pie chart fills to show percentage breakdowns, with numerical values updating in real-time. Horizontal bar graphs also expand, alongside a 'Total' counter. This clean, modern animation is ideal for enhancing business presentations, financial reports, statistical analyses, or technology demonstrations, providing an engaging way to convey complex information visually.


Animated Data Presentation with Dynamic Charts and Graphs by Stockpot49