


3D Bar Graph with Financial Data Decline Animation
By Arif_BalayevAttributes
- Length
- 0:10
- Resolution
- 1920 x 1080
- File Size
- 80.1 MB
- Frame Rate
- 29.97 fps
- Alpha Channel
- No
- Looped
- No
- Video Encoding
- ProRes
- Orientation
- Horizontal
- Commercial License
- Further Information
Description
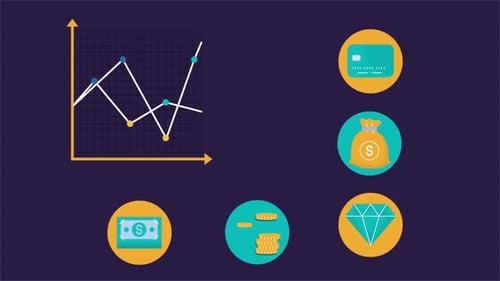
This animated 3D visual depicts a bar graph illustrating a business or financial downturn. Four metallic bars sequentially rise from a flat base, representing data points. Above the graph, a spinning gear with a prominent dollar sign coin symbolizes financial mechanisms. A diagonal arrow then appears, moving downwards across the graph, powerfully indicating a decline or negative trend. The sleek, modern design and dark background create a professional and impactful visual, suitable for corporate reports, economic analyses, news segments, or presentations requiring clear data visualization of financial performance, market shifts, or statistical decreases.


3D Bar Graph with Financial Data Decline Animation by Arif_Balayev