


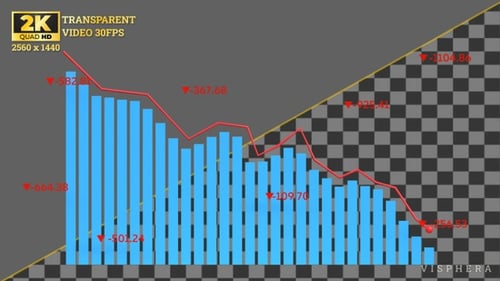
Animated Bar Graph with Decreasing Data Trend
By Visphera- Length
- 0:09
- Resolution
- 2560 x 1440
- File Size
- 555 MB
- Frame Rate
- 30 fps
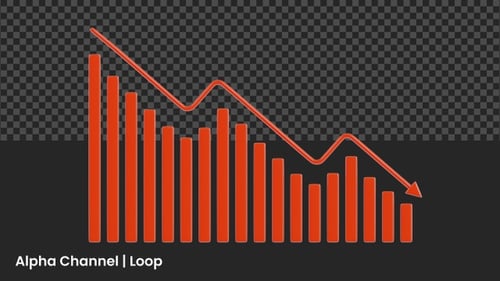
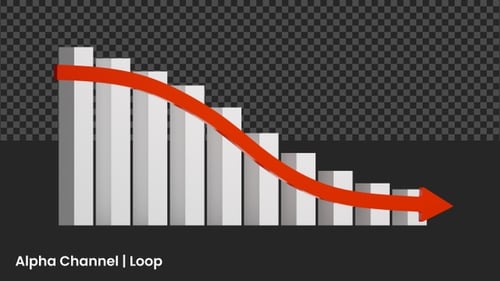
- Alpha Channel
- Yes
- Looped
- Yes
- Video Encoding
- ProRes
- Orientation
- Horizontal
- Commercial License
- Further Information
Description
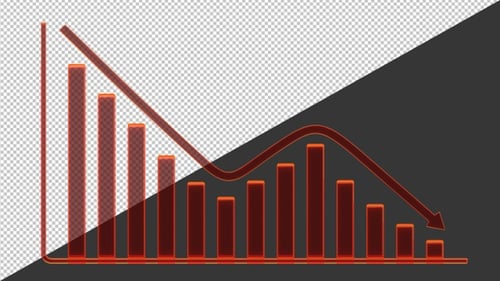
This animated bar graph visualizes data with a clear downward trend. Blue bars animate in from left to right, their heights dynamically adjusting to represent decreasing values. A red line graph, accompanied by a red marker, traces the upper edge of these bars, emphasizing the fluctuating but generally falling data points. Red numerical values, preceded by downward arrows, appear and fade around the graph, highlighting negative changes and reinforcing the declining pattern. The clean, modern aesthetic with a stark black background ensures the data remains the focal point, while the bright blue bars and red accent colors provide visual clarity. This animated clip is ideal for corporate presentations, financial reports, or news segments that require a clear, concise, and impactful representation of negative growth, losses, or downward trends.


Animated Bar Graph with Decreasing Data Trend by Visphera