


Animated Speedometer with Bar Chart Data Analysis
By ekanurma- Length
- 0:07
- Resolution
- 3840 x 2160
- File Size
- 3.65 MB
- Frame Rate
- 30 fps
- Alpha Channel
- No
- Looped
- No
- Video Encoding
- H.264
- Orientation
- Horizontal
- Commercial License
- Further Information
Description
This animated clip presents a dynamic visual representation of data analysis and performance measurement. It features a flat design speedometer with a moving needle and filling purple indicator, symbolizing progress or speed. Alongside, a bar chart appears with a magnifying glass systematically scanning across its bars, emphasizing detailed examination and analysis of data. The clean, minimalist aesthetic with its vibrant purple and white color scheme makes it suitable for corporate presentations, business reports, educational content, or technology-related explainer videos. This visual asset effectively conveys concepts of growth, efficiency, and meticulous data review, enhancing any project requiring clear and engaging data visualization.


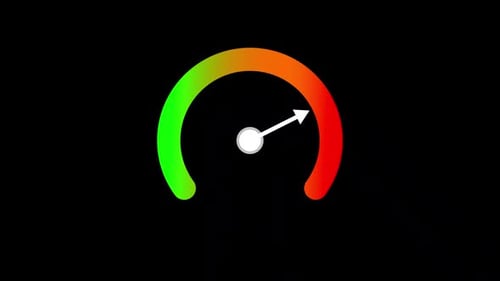


Animated Speedometer with Bar Chart Data Analysis by ekanurma