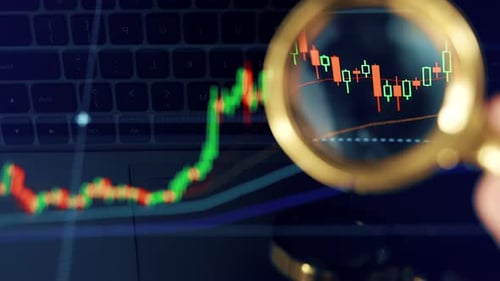
Candlestick Chart Analysis with Magnifying Glass and Trading Signals
By ekanurmaOne great value subscription from $16.50/month
- Unlimited downloads of 26+ million creative assets
- AI Tools: video, image and more
- Lifetime commercial license
- Easy cancellation
- Length
- 0:07
- Resolution
- 3840 x 2160
- File Size
- 6.23 MB
- Frame Rate
- 30 fps
- Alpha Channel
- No
- Looped
- No
- Video Encoding
- H.264
- Orientation
- Horizontal
- Commercial License
- Further Information
Description
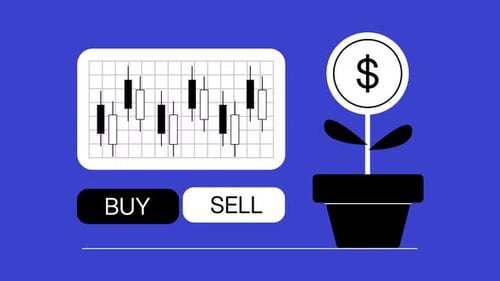
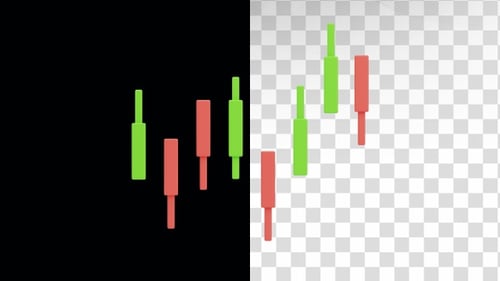
This animated clip visually represents the intricate process of financial market analysis, specifically focusing on candlestick charts. A grid-based chart, composed of vibrant red and green candlesticks indicating market movements, serves as the central element. A dynamic magnifying glass glides smoothly across this chart, pausing to zoom in on specific candlesticks to highlight details. Upon magnification, clear textual indicators – either a crisp green 'SELL' or a bold red 'BUY' – animate into view, signifying potential trading opportunities or critical decision points within the market. The clean, flat design aesthetic, characterized by its bold colors against a deep blue background, ensures high readability and a professional appearance. This compelling visual effect is perfect for enhancing educational content, corporate presentations, financial news segments, or explainer videos aiming to simplify complex stock trading concepts. It effectively demonstrates technical analysis, market trend identification, and the mechanics of financial decision-making for investors and analysts alike.