


Animated Oil Price Drop Graph with Currency Decline
By PixoArt- Length
- 0:08
- Resolution
- 1920 x 1080
- File Size
- 943 KB
- Frame Rate
- 29.97 fps
- Alpha Channel
- No
- Looped
- No
- Video Encoding
- H.264
- Orientation
- Horizontal
- Commercial License
- Further Information
Description
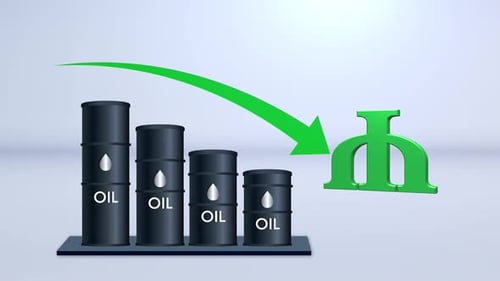
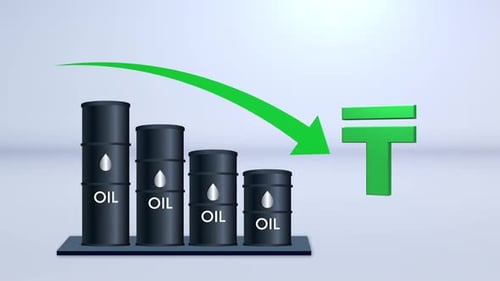
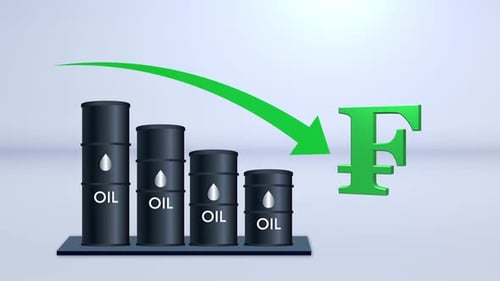
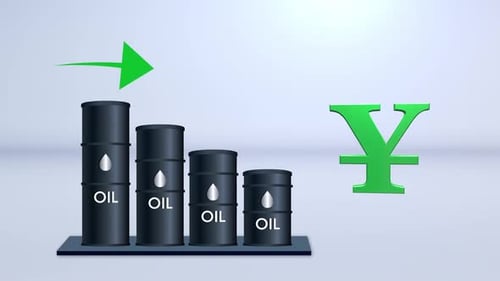
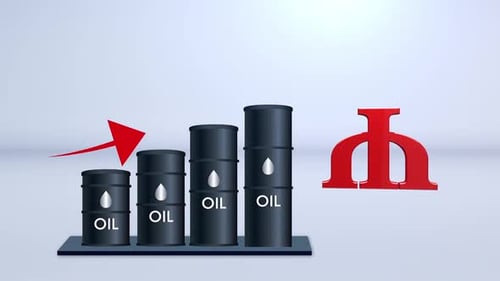
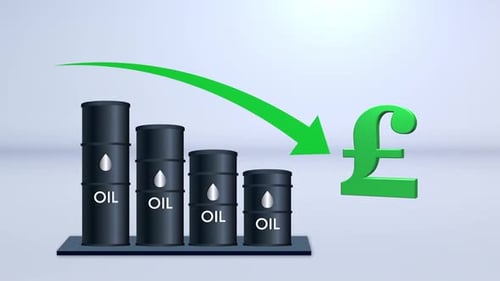
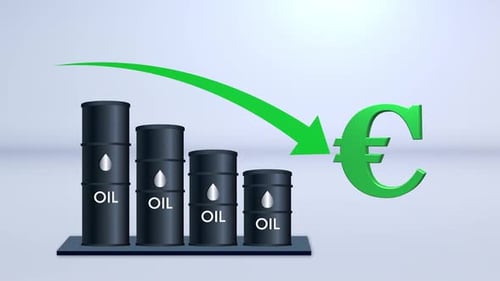
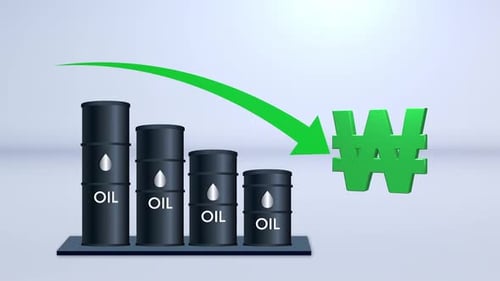
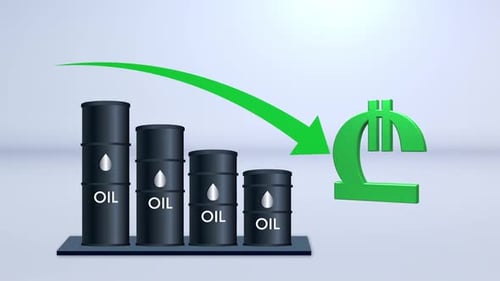
This animated clip visualizes a decrease in value, likely related to oil prices and currency exchange rates. Three-dimensional oil barrels smoothly form a bar graph, with their heights diminishing from left to right. A dynamic green arrow sweeps downwards, visually reinforcing the trend of decline. A prominent currency symbol, the Azerbaijani Manat, is also displayed, suggesting a correlation with the falling commodity value. The clean, modern design with subtle reflections provides a professional and clear presentation of data. This asset is ideal for financial news, market analysis, economic reports, or corporate presentations illustrating commodity price drops and their impact on currency.


Animated Oil Price Drop Graph with Currency Decline by PixoArt