


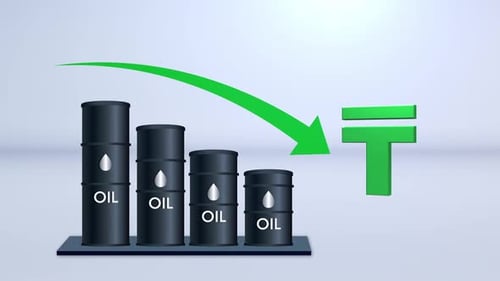
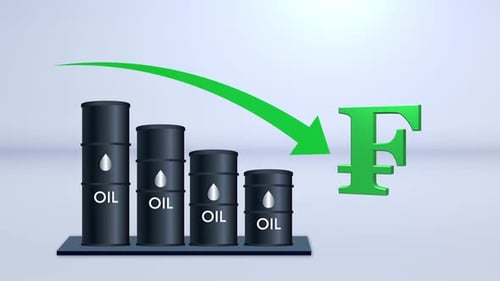
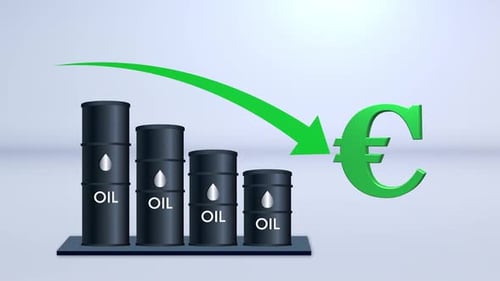
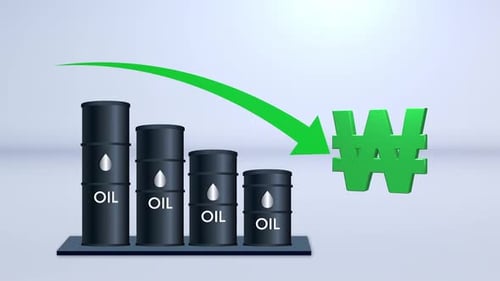
3D Animated Chart: Oil Price Decline and Indian Rupee Impact
By PixoArt- Length
- 0:08
- Resolution
- 1920 x 1080
- File Size
- 730 KB
- Frame Rate
- 29.97 fps
- Alpha Channel
- No
- Looped
- No
- Video Encoding
- H.264
- Orientation
- Horizontal
- Commercial License
- Further Information
Description
This animated 3D visual depicts a dynamic economic scenario, illustrating the relationship between oil prices and the Indian Rupee. Smoothly rendered black oil barrels, progressively decreasing in height from left to right, signify a decline in oil supply or price, often associated with a drop in demand or increased production. A prominent, arcing green arrow descends from the decreasing barrels towards a vibrant green Indian Rupee symbol, emphasizing a direct or inverse correlation, possibly indicating a depreciating currency value due to factors related to the oil market or a broader economic downturn. The animation is presented in a clean and professional style, utilizing subtle lighting and shadows to create realistic depth and visual impact for the 3D elements. This engaging motion graphic is ideal for corporate presentations, financial news segments, economic reports, or educational content requiring clear and impactful data visualization. It effectively communicates complex economic trends in an easily digestible format, making it suitable for financial analysts, business journalists, and educators looking to enhance their visual storytelling with professional, data-driven animations.
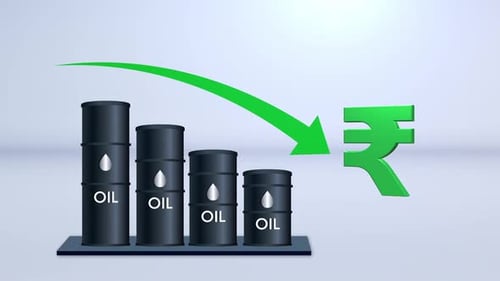


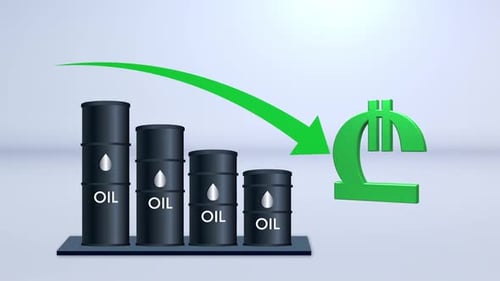


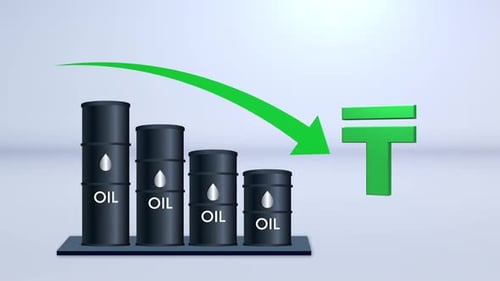


3D Animated Chart: Oil Price Decline and Indian Rupee Impact by PixoArt