


.jpg?w=500&cf_fit=cover&q=85&format=auto&s=11c67854324a3eed2b1e3706cf41f9e673dfb9549b94b3e136ea4be7a5c99da2)
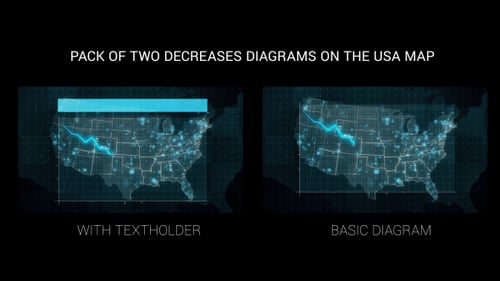
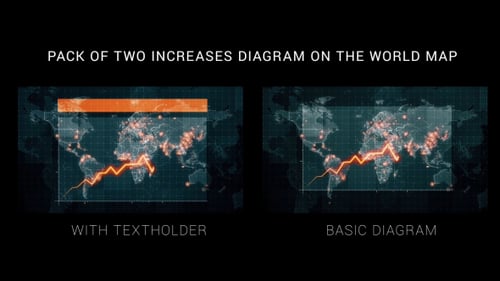
Global Data Trend Line Graph on Animated World Map
By rodionovaAttributes
- Length
- 0:20
- Resolution
- 1920 x 1080
- File Size
- 1.01 GB
- Frame Rate
- 30 fps
- Alpha Channel
- No
- Looped
- No
- Video Encoding
- Photo JPEG
- Orientation
- Horizontal
- Commercial License
- Further Information
Description
This animated visual features a digital world map overlaid with a grid and numerous glowing data points. A dynamic line graph traces a trend, primarily indicating a decrease in values with percentage changes appearing at various points. The futuristic design, with its vibrant blue accents against a dark background, makes it ideal for corporate presentations, technological reports, or any content requiring a sophisticated visualization of global data trends and analytics.

.jpg?w=500&cf_fit=cover&q=85&format=auto&s=a95280fadc449abf9acc7d72319d0bd69604f8ee9bc0f1af4672c766f588c184)


Global Data Trend Line Graph on Animated World Map by rodionova