


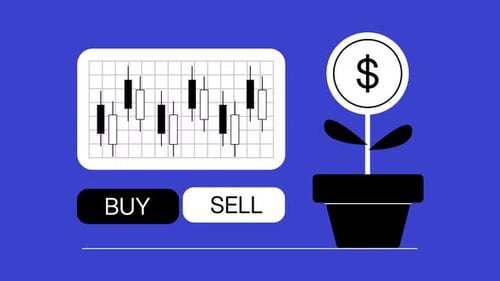
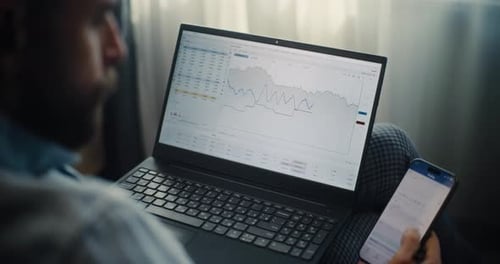
Animated Laptop Showing Financial Candlestick Chart with Buy Sell Indicators
By ekanurma- Length
- 0:07
- Resolution
- 3840 x 2160
- File Size
- 1.33 MB
- Frame Rate
- 30 fps
- Alpha Channel
- No
- Looped
- No
- Video Encoding
- H.264
- Orientation
- Horizontal
- Commercial License
- Further Information
Description
This animated graphic presents a sleek, flat design laptop showcasing a dynamic financial candlestick chart. The screen comes to life with fluctuating green and red candles, visually representing market trends and price movements over time. Prominently featured are "BUY" and "SELL" indicators, clearly marked with upward and downward arrows respectively, which appear to highlight key decision points in a trading scenario. The clean, modern aesthetic uses solid colors and a dark blue background, providing a professional and easily digestible visual for complex financial data. The animation is smooth and purposeful, designed to convey clarity and precision. This visual asset is an excellent tool for content creators developing presentations, explainer videos, or digital media focused on finance, stock market analysis, investment strategies, and corporate reporting. It effectively communicates the ebb and flow of market activity and critical trading decisions, adding an engaging and informative element to projects that require a clear, dynamic depiction of economic data. Its simple yet effective design ensures broad applicability across various professional and educational contexts.


Animated Laptop Showing Financial Candlestick Chart with Buy Sell Indicators by ekanurma