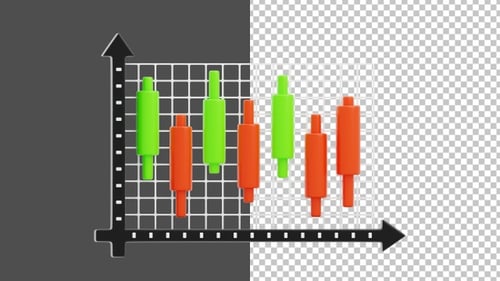
Animated 3D Candlestick Graph for Stock Market Analysis
By UnerispaceOne great value subscription from $16.50/month
- Unlimited downloads of 26+ million creative assets
- AI Tools: video, image and more
- Lifetime commercial license
- Easy cancellation
Attributes
- Length
- 0:08
- Resolution
- 3840 x 2160
- File Size
- 197 MB
- Frame Rate
- 30 fps
- Alpha Channel
- Yes
- Looped
- No
- Video Encoding
- ProRes
- Orientation
- Horizontal
- Commercial License
- Further Information
Description
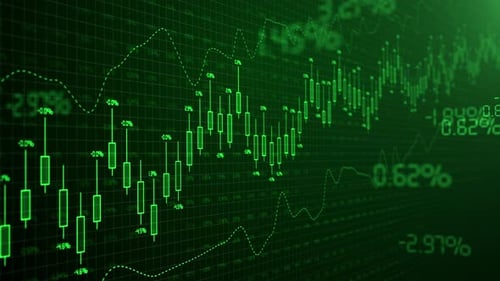
This animation features a dynamically rendered 3D candlestick chart, meticulously designed to visualize financial market data. The individual candlestick elements, represented by vibrant red, green, and yellow bars, animate fluidly, growing and shrinking to illustrate price movements and trading patterns. With its clean lines and modern 3D aesthetic, this graphic offers a professional and engaging way to represent complex financial information. It is ideal for enhancing corporate presentations, financial reports, stock market analysis videos, and digital content that aims to clearly communicate economic trends and investment insights.