


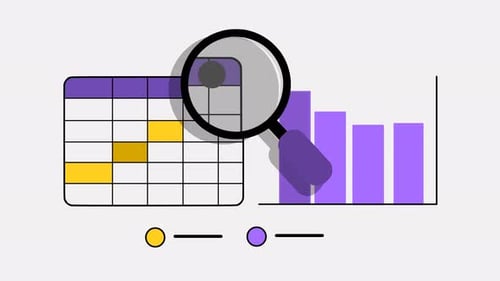
Data Analysis Infographic Animation with Magnifying Glass
By ekanurma- Length
- 0:07
- Resolution
- 3840 x 2160
- File Size
- 3.22 MB
- Frame Rate
- 30 fps
- Alpha Channel
- No
- Looped
- No
- Video Encoding
- H.264
- Orientation
- Horizontal
- Commercial License
- Further Information
Description
The animation showcases data analysis through two distinct visuals: a calendar grid and a bar chart. A magnifying glass dynamically scans the calendar, highlighting specific yellow-marked cells, then transitions to examine the purple bars of the chart, drawing attention to individual data points. Rendered in a clean flat design style with a minimalist aesthetic and a vibrant purple and yellow color palette, this animated clip is ideal for corporate presentations, business reports, educational materials, or any project requiring a visual representation of data scrutiny, planning, or statistical review. It effectively communicates concepts of detailed examination and insight extraction.


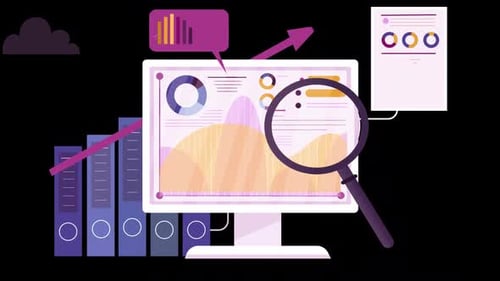


Data Analysis Infographic Animation with Magnifying Glass by ekanurma