


Animated Business Charts with Magnifying Glass Data Analysis
By ekanurma- Length
- 0:07
- Resolution
- 3840 x 2160
- File Size
- 3.8 MB
- Frame Rate
- 30 fps
- Alpha Channel
- No
- Looped
- No
- Video Encoding
- H.264
- Orientation
- Horizontal
- Commercial License
- Further Information
Description
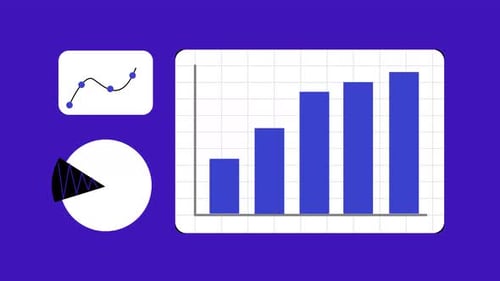
This animated visual effect presents a clean, flat design interpretation of data analysis. Three distinct infographic elements — a bar chart, a pie chart, and a process flow diagram — are introduced with dynamic, smooth animations. As these data visualizations come to life, a magnifying glass icon slides across the screen, drawing attention to different sections and simulating a detailed inspection of the information. Rendered in a modern, professional color palette against a light background, this animation is ideal for corporate presentations, business reports, educational videos, or any project requiring a clear and engaging display of data. It enhances the narrative by visually representing complex information in an easily digestible format, perfect for illustrating financial growth, market trends, or project milestones.


Animated Business Charts with Magnifying Glass Data Analysis by ekanurma