Digital Financial Stock Market Data Candlestick Chart Animation
By KanawatTHOne great value subscription from $16.50/month
- Unlimited downloads of 26+ million creative assets
- AI Tools: video, image and more
- Lifetime commercial license
- Easy cancellation
Attributes
- Length
- 0:30
- Resolution
- 3840 x 2160
- File Size
- 1.92 GB
- Frame Rate
- 30 fps
- Alpha Channel
- No
- Looped
- No
- Video Encoding
- Apple ProRes 422
- Orientation
- Horizontal
- Commercial License
- Further Information
Description
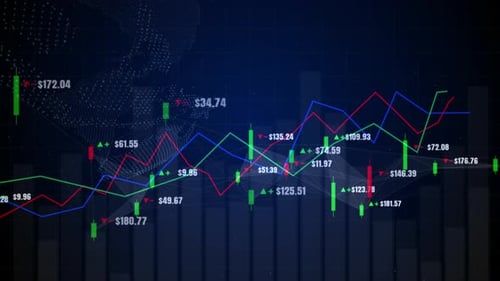
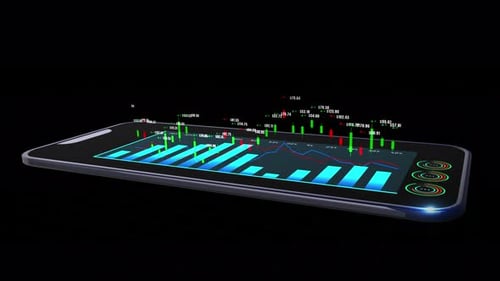
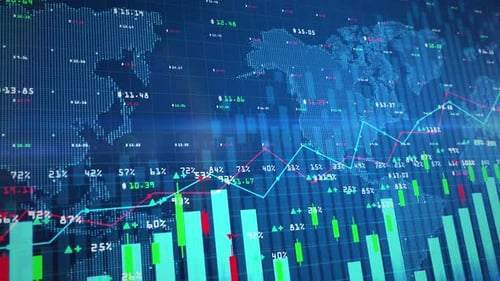
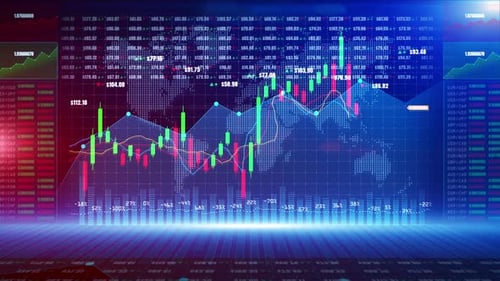
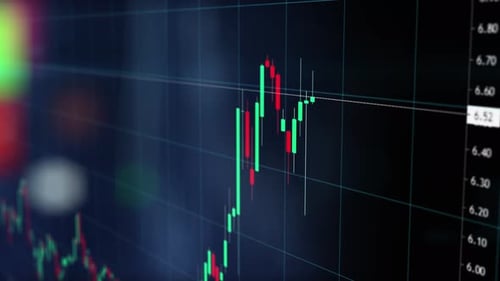
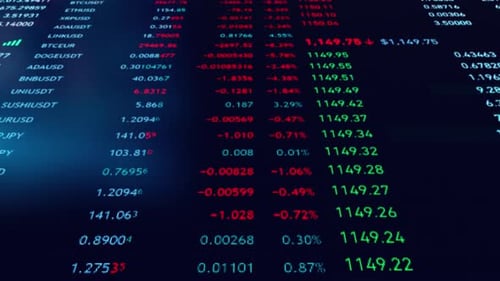
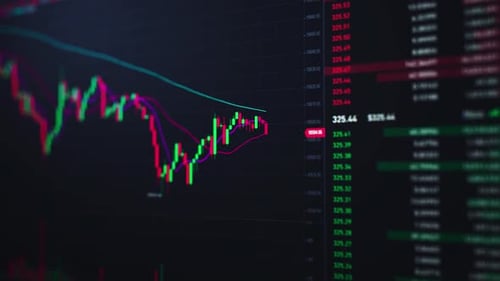
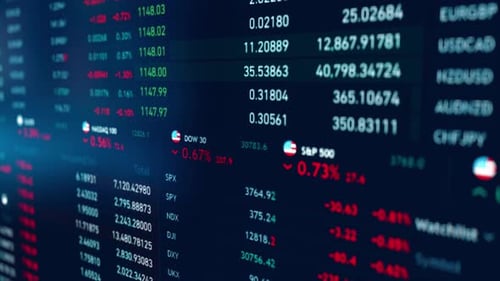
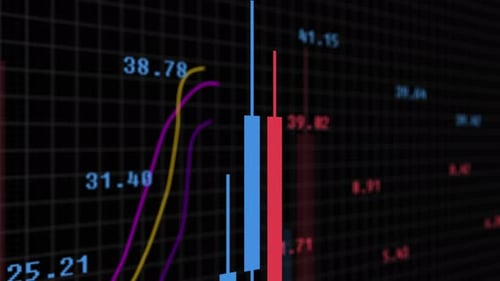
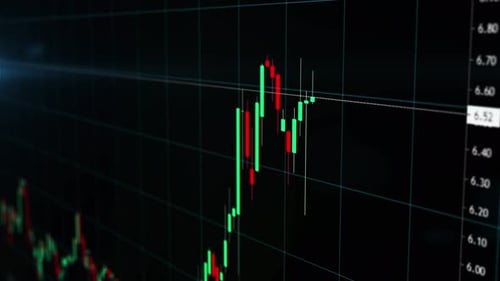
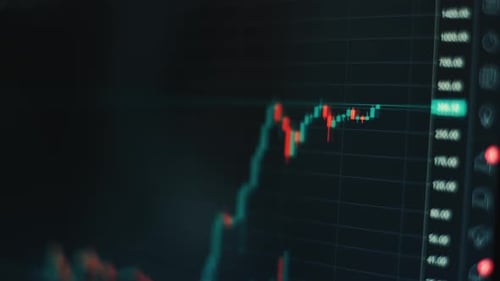
This animated background features a dynamic display of financial stock market data, presenting a modern and sophisticated visual for business, technology, and finance-related content. Vibrant green candlestick charts and red decreasing indicators float across a dark grid, representing market fluctuations. Numerical values and line graphs continuously animate, illustrating trends and data flow. This clean and professional animation is ideal for enhancing presentations, reports, news segments, or any project requiring a clear and engaging representation of economic or trading information. The digital interface provides an effective visual metaphor for growth, decline, and financial analytics.