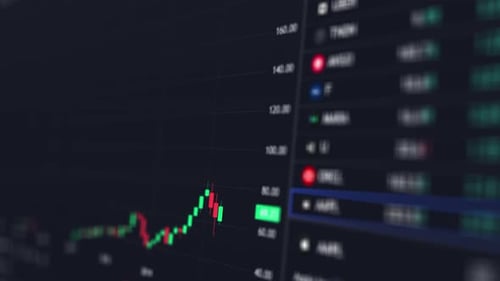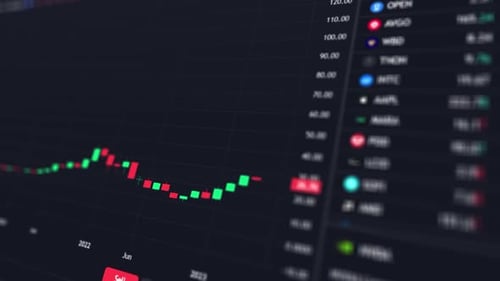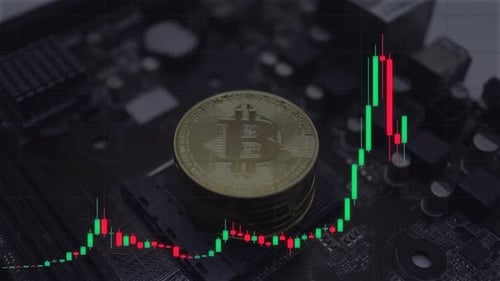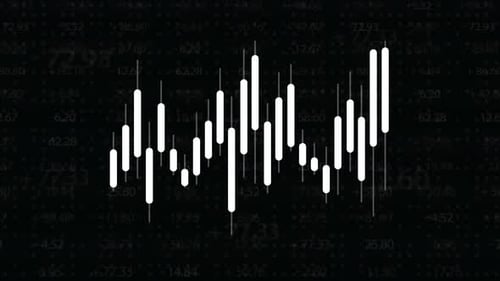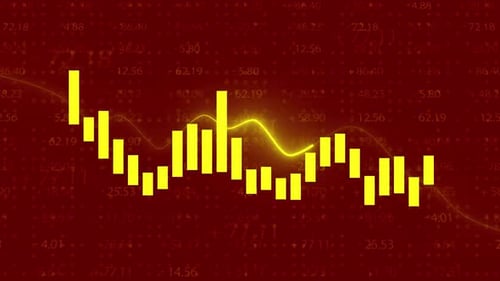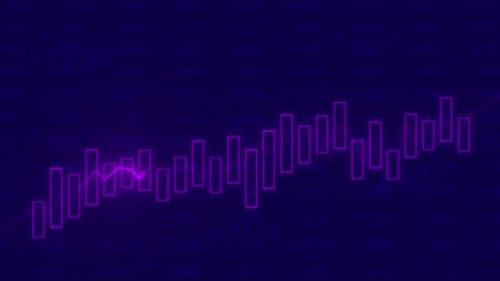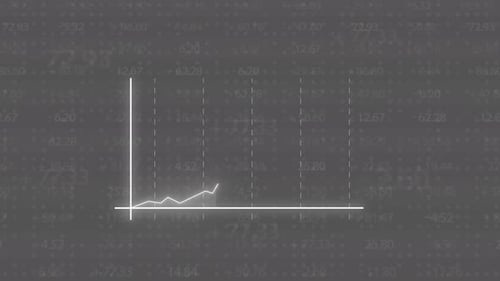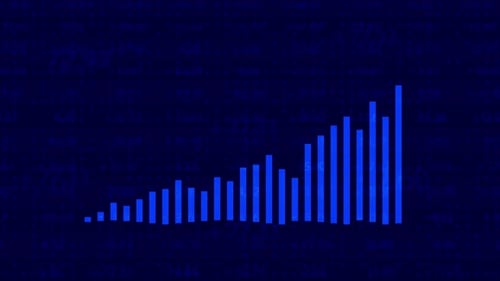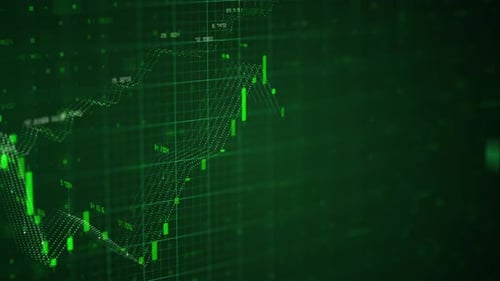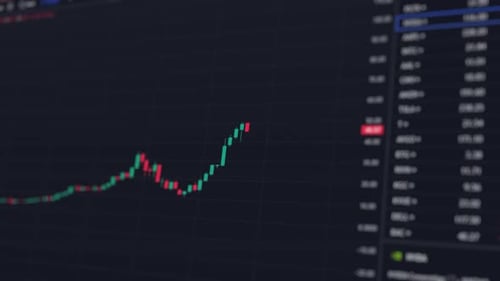
Dark Background Stock Market Candlestick Chart Uptrend.
By ibeydesignOne great value subscription from $16.50/month
- Unlimited downloads of 26+ million creative assets
- AI Tools: video, image and more
- Lifetime commercial license
- Easy cancellation
Attributes
- Length
- 0:14
- Resolution
- 3840 x 2160
- File Size
- 7.12 MB
- Frame Rate
- 30 fps
- Alpha Channel
- No
- Looped
- No
- Video Encoding
- H.264
- Orientation
- Horizontal
- Commercial License
- Further Information
Description
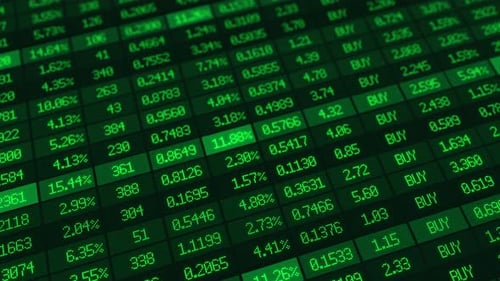
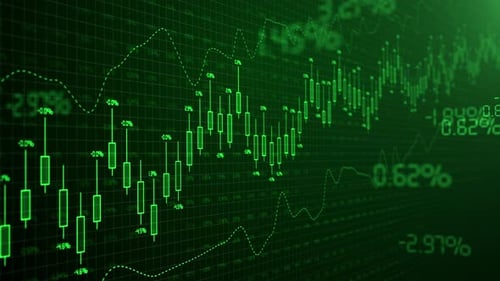
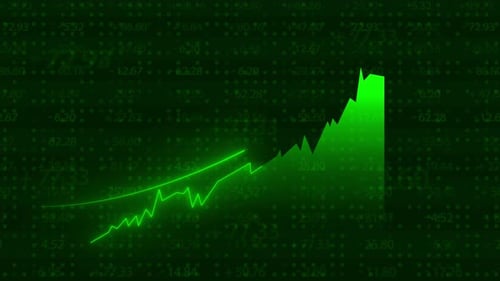
This animated clip presents a dynamic candlestick chart, illustrating real-time fluctuations in financial markets such as stocks or cryptocurrencies. Green and red candles visually represent price movements, while a clean grid and numerical data points provide clear market insights. The modern digital interface with a dark background and subtle grid lines creates a professional and focused visual. This animation is ideal for enhancing financial news segments, corporate presentations, market analysis videos, or educational content related to trading and investment strategies, offering a clear and engaging way to visualize complex financial data.