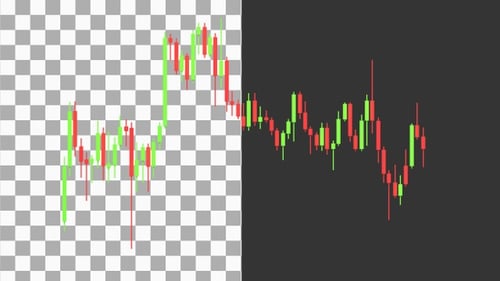
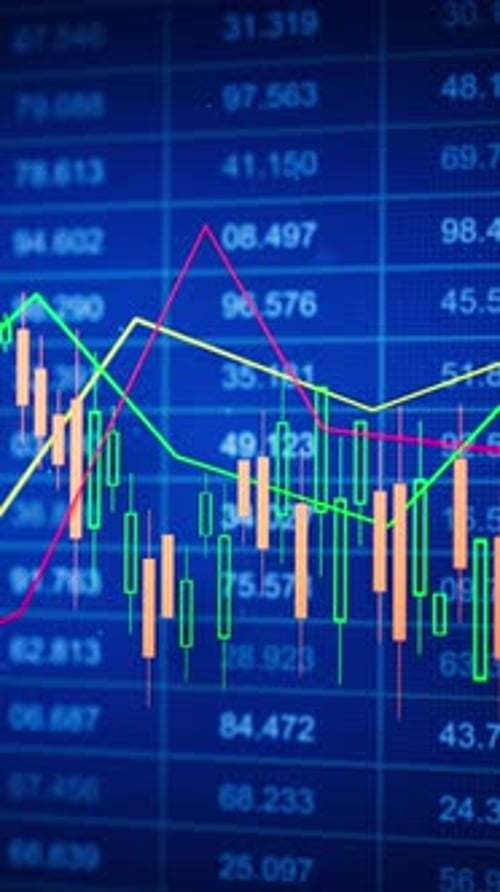
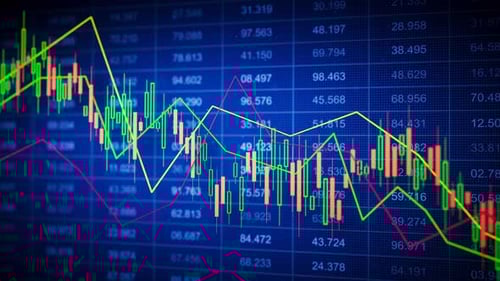
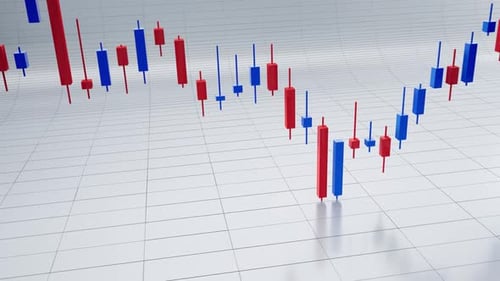
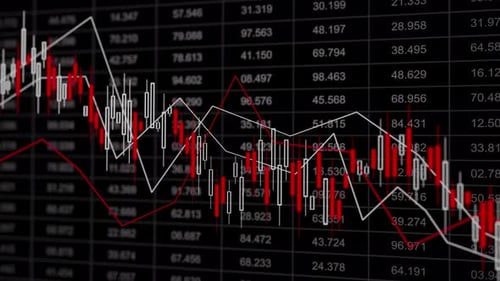
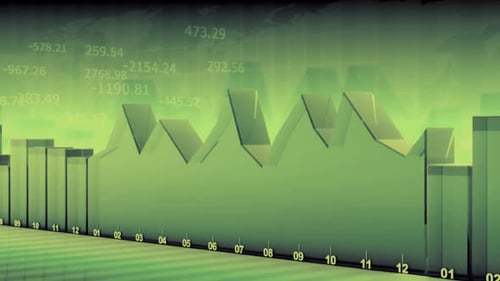
Dynamic Stock Market Candlestick Chart Investment Trading Financial Graph Data Analysis Price Moveme
By MhabibtantowiOne great value subscription from $16.50/month
- Unlimited downloads of 26+ million creative assets
- AI Tools: video, image and more
- Lifetime commercial license
- Easy cancellation
Attributes
- Length
- 0:10
- Resolution
- 3840 x 2160
- File Size
- 26.5 MB
- Frame Rate
- 30 fps
- Alpha Channel
- No
- Looped
- No
- Video Encoding
- H.264
- Orientation
- Horizontal
- Commercial License
- Further Information
Description
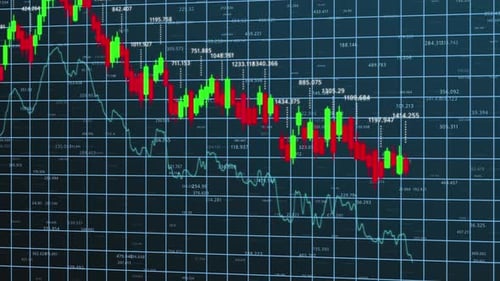
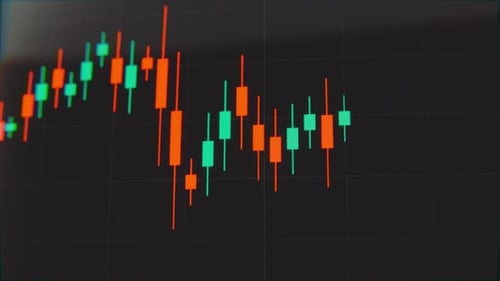
This animated clip presents a dynamic financial candlestick chart, vividly illustrating market trends and trading data. The display features a dark background with a grid, showing yellow and green candlesticks indicating price movements, alongside red and green moving average lines that fluctuate with the data. The animation suggests real-time analysis of stock or cryptocurrency performance, making it an ideal visual asset for corporate presentations, financial reports, economic news segments, or any project requiring compelling data visualization. It conveys concepts of growth, decline, and market volatility with a modern, digital aesthetic.