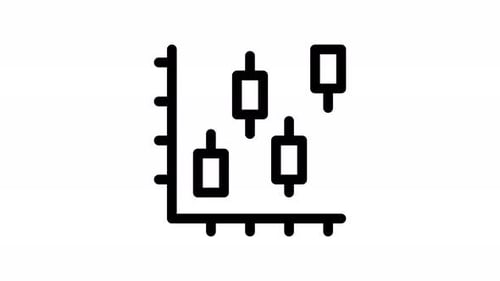
Animated Candlestick Chart Icon for Financial Data Visualization
By Haca_StudioOne great value subscription from $16.50/month
- Unlimited downloads of 26+ million creative assets
- AI Tools: video, image and more
- Lifetime commercial license
- Easy cancellation
Attributes
- Length
- 0:06
- Resolution
- 3840 x 2160
- File Size
- 50.5 MB
- Frame Rate
- 30 fps
- Alpha Channel
- Yes
- Looped
- Yes
- Video Encoding
- ProRes
- Orientation
- Horizontal
- Commercial License
- Further Information
Description
This animated icon features a clean, minimalist candlestick chart. Four black outline rectangles representing candlesticks dynamically adjust, extending thin 'wicks' both above and below each body in a looping motion. Set against a pure white background, the animation uses simple line art to convey financial data points. Ideal for presentations, explainer videos, or digital interfaces related to finance, stock markets, trading, or economic analysis, this clip provides clear and concise data visualization. Its straightforward design ensures easy integration and effective communication of complex financial trends.