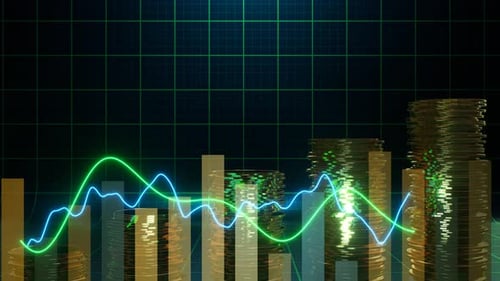
Futuristic Candlestick Chart for Stock Market Data Analysis
By BaldasaridstockOne great value subscription from $16.50/month
- Unlimited downloads of 26+ million creative assets
- AI Tools: video, image and more
- Lifetime commercial license
- Easy cancellation
- Length
- 0:15
- Resolution
- 3840 x 2160
- File Size
- 111 MB
- Frame Rate
- 29.97 fps
- Alpha Channel
- No
- Looped
- No
- Video Encoding
- H.264
- Orientation
- Horizontal
- Commercial License
- Further Information
Description
This dynamic animation presents a sophisticated three-dimensional candlestick chart, meticulously visualizing complex data points with fluctuating rising and falling values. Numeric indicators and a detailed grid system establish a comprehensive data-rich environment, as lines and dots fluidly form an evolving graph against a dark, digital background. The aesthetic is distinctly futuristic and technical, utilizing a dark palette accented by bright, glowing orange, blue, and white elements. The motion is smooth, analytical, and purposeful, designed to emphasize data flow and advanced information presentation. Ideal for enhancing business presentations, financial reports, or technology-focused content, this clip provides a professional and dynamic visual representation of analytical data, market trends, or abstract technological processes.