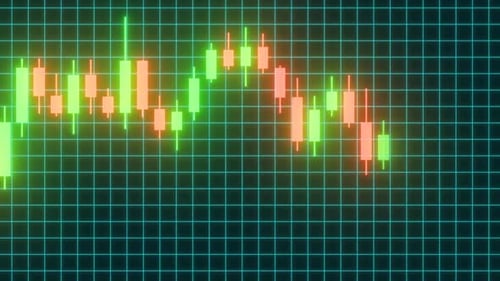
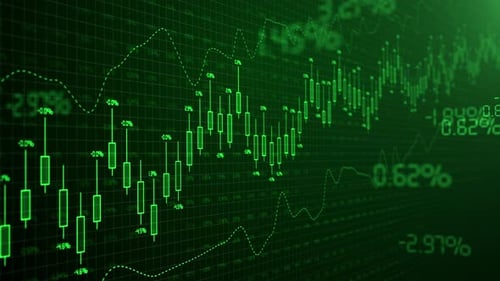
Stock Market Candlestick Chart Pattern Investment Finance Diagram - 4K
By IncrediVFXOne great value subscription from $16.50/month
- Unlimited downloads of 26+ million creative assets
- AI Tools: video, image and more
- Lifetime commercial license
- Easy cancellation
Attributes
- Length
- 0:28
- Resolution
- 3840 x 2160
- File Size
- 420 MB
- Frame Rate
- 60 fps
- Alpha Channel
- No
- Looped
- Yes
- Video Encoding
- H.264
- Orientation
- Horizontal
- Commercial License
- Further Information
Description
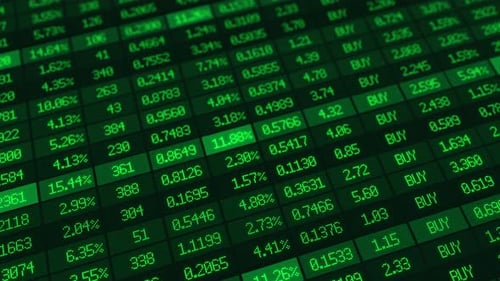
This dynamic animated clip displays a glowing candlestick chart moving across a dark digital grid background. It features bright neon green bars indicating upward trends and red bars showing downward movements, effectively illustrating market fluctuations and financial data points. The sleek design and continuous motion provide a modern, futuristic aesthetic. This visual asset is perfect for projects related to finance, stock markets, cryptocurrency, business analysis, and digital technology, offering a compelling background or illustrative element for presentations, news segments, or corporate videos to convey concepts of investment, growth, and economic trends.