


Animated Oil Barrels and Euro Price Decline Infographic
By PixoArtAttributes
- Length
- 0:08
- Resolution
- 1920 x 1080
- File Size
- 866 KB
- Frame Rate
- 29.97 fps
- Alpha Channel
- No
- Looped
- No
- Video Encoding
- H.264
- Orientation
- Horizontal
- Commercial License
- Further Information
Description
This animated infographic visualizes a decline in value, featuring a set of black oil barrels arranged in decreasing height to form a dynamic bar chart. Each barrel is marked with 'OIL' and a silver oil drop icon, representing a commodity. Alongside, a prominent green Euro currency symbol stands. A curving green arrow animates downwards from the upper left, clearly indicating a price drop or economic decrease related to oil and the Euro. This clean, modern animation is ideal for business presentations, financial reports, economic news segments, or any content requiring a clear visual representation of market trends and value fluctuations.
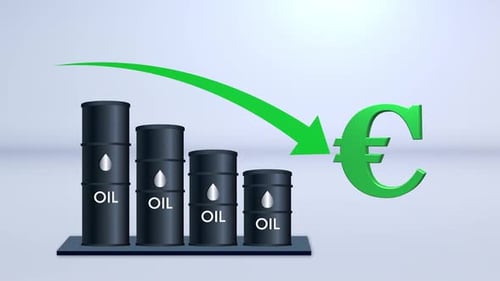


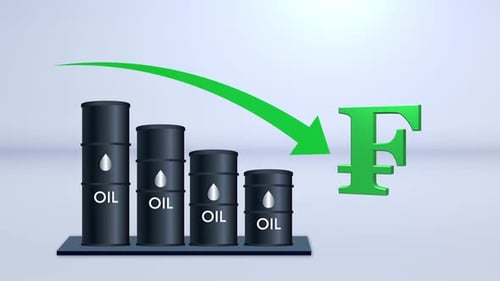

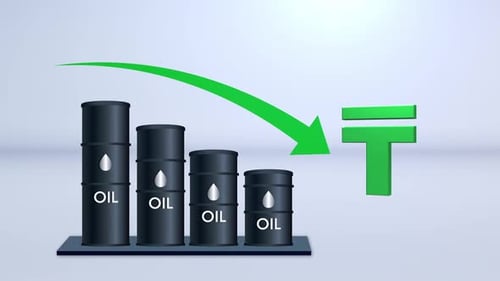


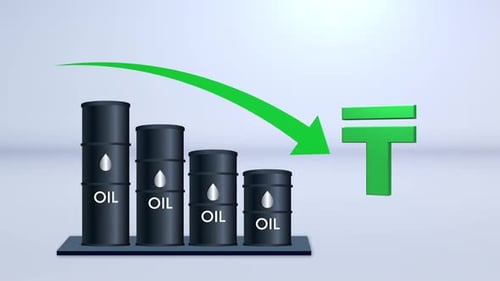
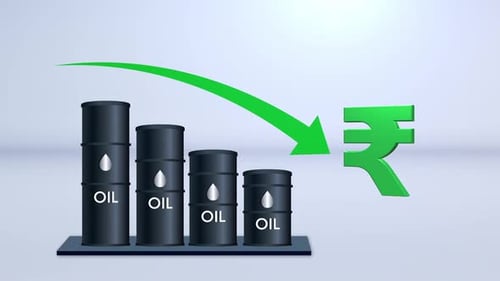

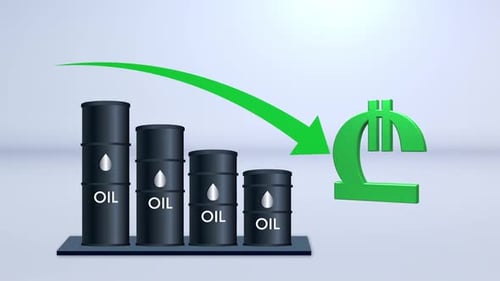


Animated Oil Barrels and Euro Price Decline Infographic by PixoArt