


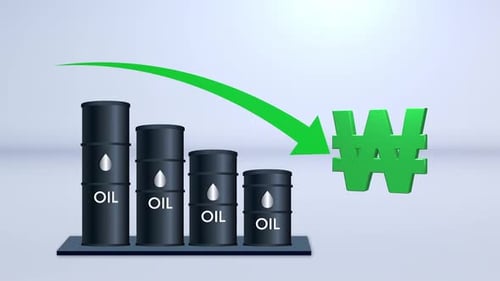
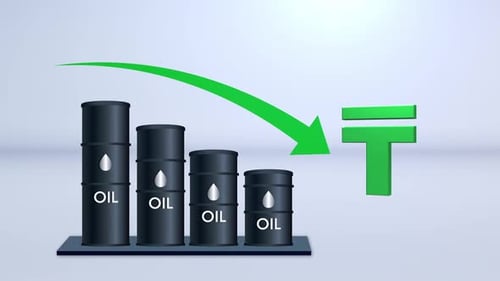
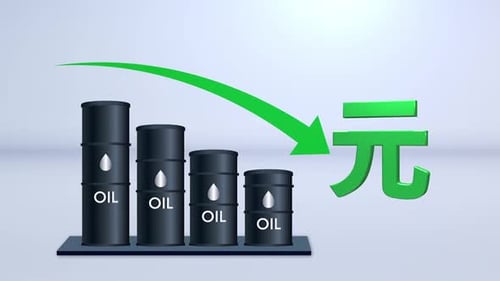
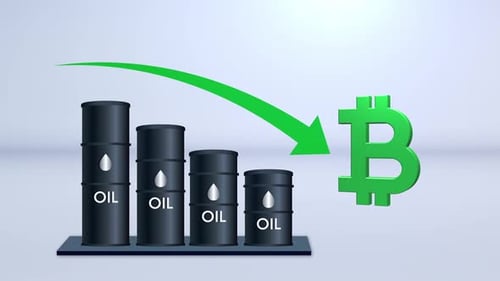
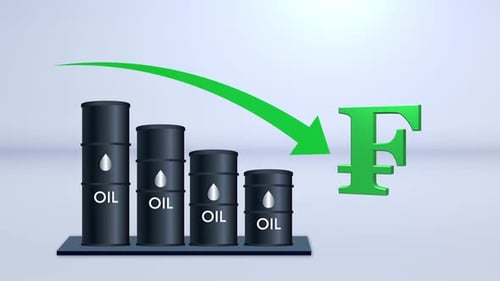
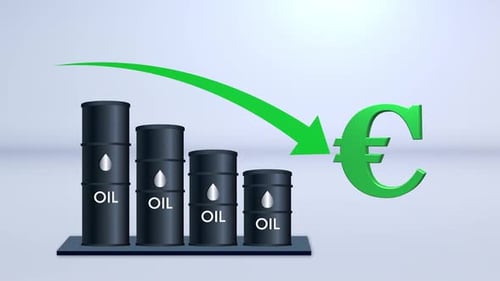
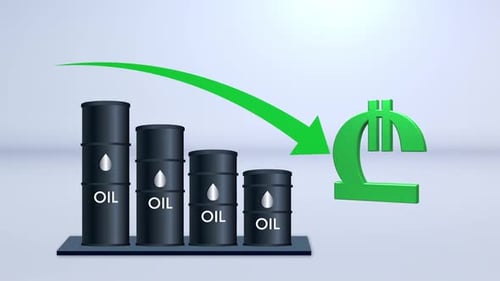
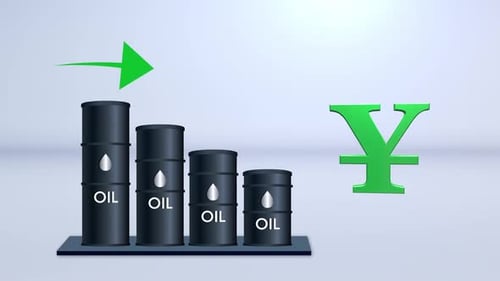
Animated Infographic Showing Oil Price Decline And Currency Impact
By PixoArt- Length
- 0:08
- Resolution
- 1920 x 1080
- File Size
- 901 KB
- Frame Rate
- 29.97 fps
- Alpha Channel
- No
- Looped
- No
- Video Encoding
- H.264
- Orientation
- Horizontal
- Commercial License
- Further Information
Description
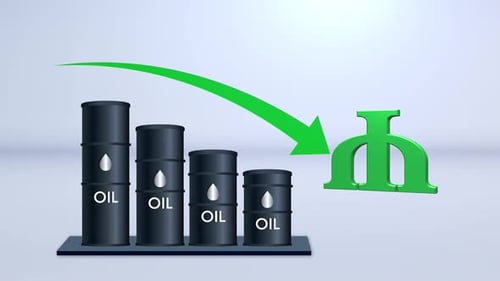
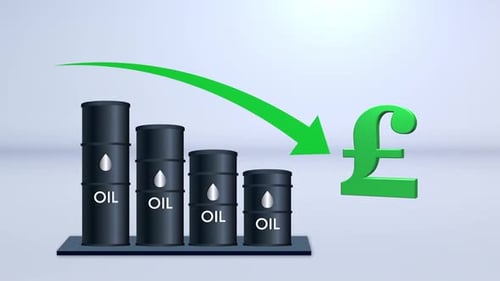
This dynamic animated infographic vividly illustrates an economic concept, depicting the decline of oil prices and its corresponding impact on currency value. Watch as 3D oil barrels steadily decrease in height, symbolizing a drop in supply or price. Simultaneously, a prominent 3D currency symbol emerges, with a clear green downward-curving arrow visually linking the falling oil levels to the currency. The clean, modern design and smooth animation make this visual asset ideal for financial reports, business presentations, market analysis videos, and economic explainers. It effectively conveys complex financial relationships with clear, engaging visuals, perfect for enhancing data-driven content.


Animated Infographic Showing Oil Price Decline And Currency Impact by PixoArt