


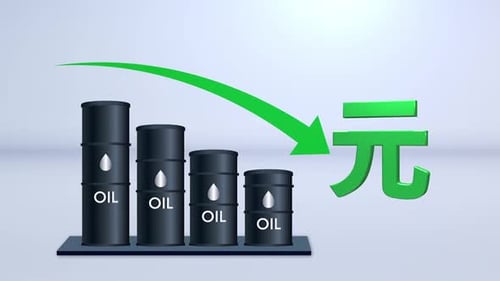
Animated Infographic: Oil Price Decline with Yuan Currency
By PixoArt- Length
- 0:08
- Resolution
- 1920 x 1080
- File Size
- 866 KB
- Frame Rate
- 29.97 fps
- Alpha Channel
- No
- Looped
- No
- Video Encoding
- H.264
- Orientation
- Horizontal
- Commercial License
- Further Information
Description
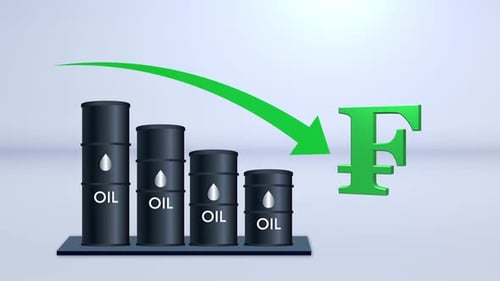
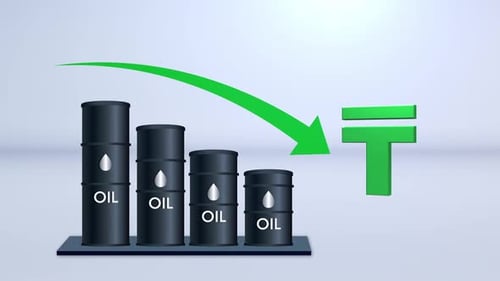
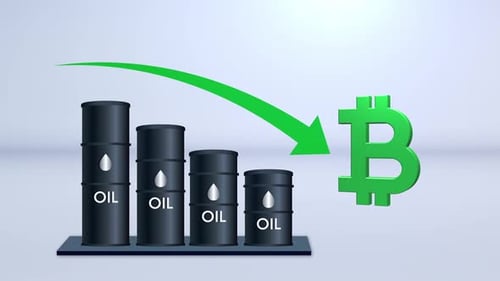
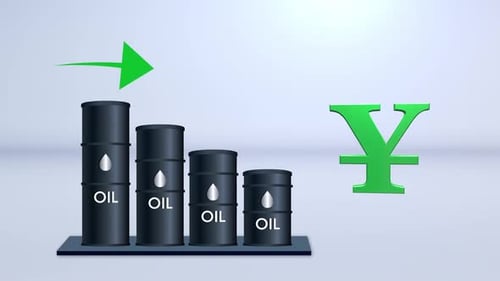
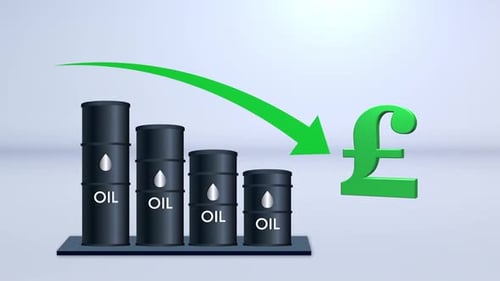
This animated infographic offers a clear visualization of an economic decline or decreasing commodity prices. The sequence begins with a minimalist setup, quickly introducing a row of black oil barrels that dynamically adjust their height, progressively shrinking to represent a falling value or reduced quantity. A vibrant green arrow seamlessly animates into the scene, sweeping downwards in a clear trajectory to underscore the negative market trend. Accompanying these visual indicators is a prominent, three-dimensional Chinese Yuan symbol, signaling the specific currency or economic region under focus. The asset's clean, modern aesthetic, characterized by polished 3D elements and subtle lighting effects, ensures a professional presentation. This visual tool is perfectly suited for corporate presentations, financial news segments, detailed market analysis videos, or educational content aiming to explain economic downturns, commodity market shifts, and currency fluctuations with compelling, easily digestible graphics. It effectively transforms complex financial data into an engaging and understandable visual narrative for a professional audience.


Animated Infographic: Oil Price Decline with Yuan Currency by PixoArt