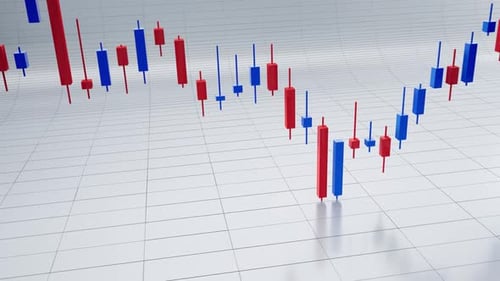
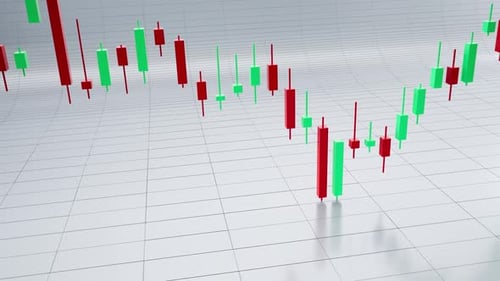
Vertical Stock Market Candlestick Chart Financial Analysis
By meshgridOne great value subscription from $16.50/month
- Unlimited downloads of 26+ million creative assets
- AI Tools: video, image and more
- Lifetime commercial license
- Easy cancellation
Attributes
- Length
- 0:11
- Resolution
- 1080 x 1920
- File Size
- 11.6 MB
- Frame Rate
- 29.97 fps
- Alpha Channel
- No
- Looped
- No
- Video Encoding
- H.264
- Orientation
- Vertical
- Commercial License
- Further Information
Description
This animated visual features a dynamic 3D candlestick chart, depicting financial market data with red and blue candles. The candles grow and fluctuate, illustrating market trends and price movements over time on a subtly lit, gridded surface. This modern and professional animation provides a clear and engaging way to visualize complex financial data, making it ideal for business presentations, economic reports, stock market analysis, and financial news segments. The clean design and fluid motion enhance the clarity of the market indicators, offering a sophisticated background for any project requiring data visualization.